Copper futures price prediction: 5 key market drivers
In April 2026, the International Copper Study Group rewrote its 2026 balance. Six months earlier, the ICSG had penciled in a refined-copper deficit of roughly 150,000 tonnes for the year.
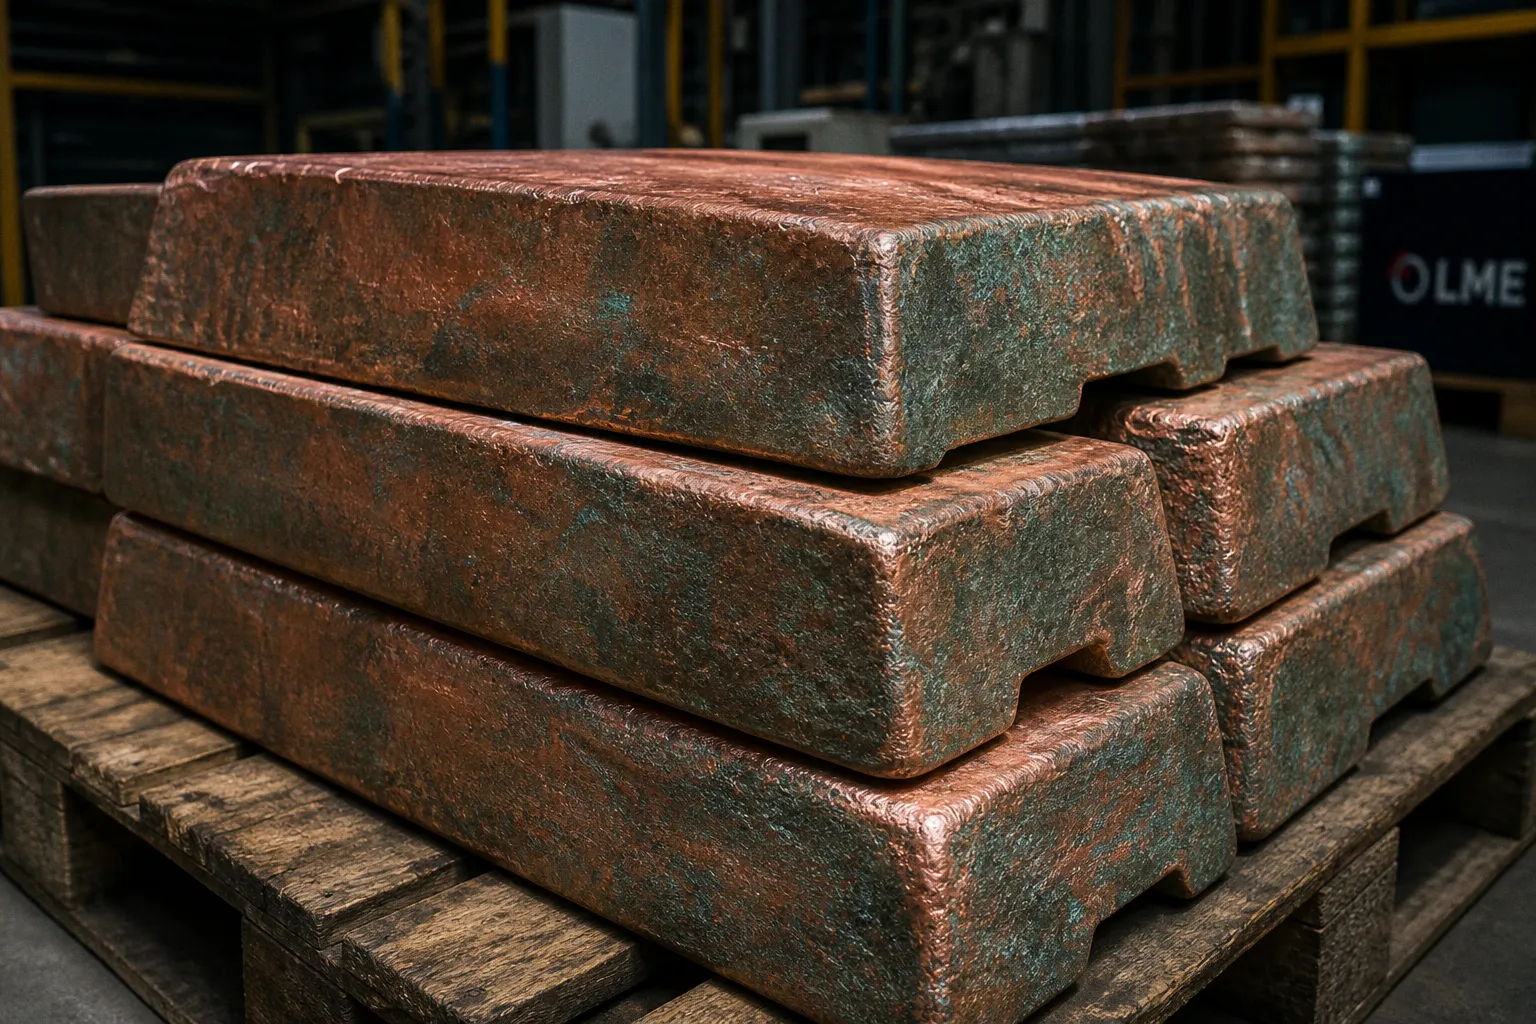
By April, that number had swung to a projected surplus of about 96,000 tonnes. The reversal — a 246,000-tonne change in expectation — did not come from a sudden surge in mine output. It came from lower anticipated usage and higher expected secondary refined production from scrap. For anyone trading copper futures, that's the kind of headline that quietly reframes the next twelve months: not a tightening physical market, but a quietly loosening one, on paper at least.
The catch is that "on paper" matters less than the metal actually moving through smelters, warehouses, and bonded zones. ICSG's own balance excludes changes in unreported Chinese stocks — State Reserve Bureau holdings, bonded warehouse tonnage, producer and consumer inventories — and LME warehouse data cover only approved exchange facilities. The visible market is a fraction of the real one. The drivers below are the ones I would actually weight when sizing a copper futures price prediction for 2026 and 2027, starting from the rock at Grasberg and ending at the warrant queue at the LME.
The 2026-2027 refined copper balance: from deficit to surplus
ICSG's April 23, 2026 forecast is the anchor document. It projects a global refined-copper surplus of about 96,000 tonnes in 2026 and 377,000 tonnes in 2027. The 2027 figure is the larger of the two and the one traders should pay closest attention to, because it sits closer to the bulk of the tradeable curve.
| Metric | 2026 forecast | 2027 forecast |
|---|---|---|
| Refined-copper balance | +~96,000 t (surplus) | +~377,000 t (surplus) |
| Mine production growth | +1.6% | +2.3% |
| Refined production growth | +0.4% | +3.0% |
| Apparent refined usage growth | +1.6% | +2.0% |
| Secondary refined production growth | n/a | +5.7% |
The refined production growth line is the one that gets glossed over. Primary electrolytic refining is forecast to grow by only 0.4% in 2026 because concentrate availability is constrained. The bulk of the supply response in 2027 is supposed to come from secondary refined production — scrap fed back into the system — growing 5.7%. Scrap is the swing producer. When Chinese fabricators, EV cell makers, and European cable producers generate enough arisings, the cathode equivalent gets displaced at the margin. The 5.7% growth in secondary output is not a guarantee; it depends on collection economics, scrap export rules, and whether copper-heavy demolition projects in China actually break ground.
Two caveats the surplus number does not capture:
- The balance uses apparent Chinese demand and explicitly excludes changes in unreported Chinese stocks. If State Reserve Bureau holdings, bonded zones, or producer-fabricator inventories are quietly rebuilding, the visible surplus can be absorbed off-market.
- LME warehouse stocks reflect only approved exchange facilities, not the full physical pile. A surplus on paper can coexist with a tightening on-warrant queue.
The 246,000-tonne swing in six months — from a 150,000-tonne deficit to a 96,000-tonne surplus — is not a forecast, it's a forecast correction. Treat the second number as the baseline, not the truth.
Mine production constraints and smelter bottlenecks
Behind that 1.6% world mine-production growth forecast sits a stack of physical incidents. ICSG specifically revised its 2026 mine-growth expectation down from 2.3%, citing downward revisions for the Democratic Republic of the Congo, Chile, and Indonesia. The named operations matter: Grasberg and Kamoa remain constrained following major incidents in 2025.
- Grasberg, Indonesia. A flagship concentrate operation. A mud rush incident in 2025 killed production through the second half of the year and constrained concentrate flows into Asian smelters well into 2026.
- Kamoa, DRC. One of the highest-grade copper complexes in the world. A 2025 incident has kept ramp-up below plan. Each quarter Kamoa slips, the concentrate market loses material that African and Chinese smelters had already booked.
- Chile. Across multiple operations, ore-grade decline and water-supply constraints continue to drag on head grade, with several new projects delayed or scaled down.
The smelter side is where the bottleneck becomes a price problem. When concentrate availability is constrained, treatment and refining charges compress toward zero — the textbook signal that the mine-to-smelter handoff is the tight link in the chain. A smelter paying miners to take concentrate off their hands is the opposite of the comfortable surplus narrative.
If smelters cut throughput in response to constrained concentrate, primary refined production falls below ICSG's 0.4% growth forecast. The 96,000-tonne surplus then becomes a smaller surplus, or a deficit, in real time. That's the volatility the futures curve is pricing — not the headline balance number, but the mine-to-smelter handoff behind it.
Demand dynamics: China's industrial growth versus global stagnation
On the demand side, ICSG forecasts global apparent refined-copper usage to grow by 1.6% in 2026 and 2.0% in 2027. The geographic split is the story. China is expected to grow refined usage by about 1.9% in 2026; the rest of the world is forecast at 1.3%. That gap is narrower than in prior cycles, but the directional point is clear: Asia is the engine, Europe and Japan are not pulling their weight.
What's actually pulling Chinese refined copper off the cathode rack:
- Grid and transmission build-out. Long-haul HVDC lines, transformer stations, and substation upgrades carry heavy copper content per kilometer and run on multi-year capex cycles.
- Air-conditioning and white-goods export demand. After a soft patch in 2024, export volumes to Southeast Asia, the Middle East, and Latin America have firmed.
- EV-related copper. Wiring harnesses, charging infrastructure, and battery copper foils are still pulling meaningful cathode tonnage, even as cell-chemistry debates grab the headlines.
What's not pulling:
- European construction. Residential and commercial starts remain weak, with several major economies well below their 2021 peaks.
- Japanese automotive. Domestic volumes are flat to soft, and copper intensity per vehicle continues to drift lower.
- US non-residential construction. Higher financing costs have pushed project starts out by quarters, not weeks.
A copper demand forecast that hangs on China growing 1.9% is, in practical terms, a Chinese grid and export forecast dressed in metal clothing.
The risk for the demand line is concentrated, not diversified. If Chinese grid capex gets rephased or property completions miss, the 1.9% evaporates fast. ICSG's balance assumes the demand number holds. Trade flows don't. And because the ICSG balance excludes unreported Chinese stocks, even a soft-looking visible demand number can quietly get absorbed by State Reserve Bureau buying or bonded-warehouse restocking.
Reading COMEX HG futures and LME physical indicators
For traders, the surest way to anchor a copper futures price prediction to the physical market is to read the warehouse data and the contract specs alongside the ICSG balance. Two contracts matter: COMEX HG and LME Copper.
COMEX Copper Futures (product code HG) are physically deliverable, with a contract unit of 25,000 pounds, quoted in U.S. cents per pound, and a minimum fluctuation of $0.0005 per pound — equal to $12.50 per tick per contract. Trading terminates on the third-last business day of the contract month. The cents-per-pound denomination is a U.S. convention; it does not directly map to LME pricing in U.S. dollars per metric tonne without explicit unit conversion and adjustments for financing, location, grade, and timing.
LME Copper is traded in lots of 25 metric tonnes, settled in U.S. dollars per tonne, and physically deliverable across the LME's global network of approved warehouses. The LME publishes daily warehouse data based on LMEsword records at 16:30 on the prior business day. Those figures cover opening and closing stocks, deliveries in and out, on-warrant and cancelled-warrant tonnage, warehouse locations, and reported metric tonnage. Stock movements, in the LME's own framing, reflect physical supply and demand.
The signals worth tracking when building a copper futures price prediction:
- Cancelled-warrant share. A rising share of cancelled warrants — material called for delivery out of LME warehouses — is a tightening signal. A falling share is loosening.
- Tonnage by location. Asian warehouses (Singapore, Taiwan, South Korea) draining while European warehouses rebuild often signals a Chinese drawdown ahead of fabrication runs.
- Spread structure. Backwardation steepening on the nearby LME curve versus COMEX is the cleanest physical-tightness read the curve can give.
The ICSG surplus forecast and the LME warehouse tape can disagree for months. The tape wins for next-month pricing; the ICSG balance matters more for the back end of the curve. A defensible copper futures price prediction weights the two accordingly, not either alone.
The long-term structural picture: the IEA pipeline versus near-term reality
The IEA's 2026 outlook complicates the near-term narrative. Under its project-pipeline assessment, the implied copper supply gap in 2035 has narrowed to 25%, from around 30% in the prior outlook. That is still a structural deficit — roughly a quarter of demand unsupplied at that horizon — but it is materially smaller than the headline number that drove the "supercycle" narrative through 2023 and 2024.
What changed: projects advanced, particularly in the DRC and Zambia. New copperbelt expansions, treatment-capacity additions, and some Chinese overseas offtake deals have pulled forward supply that the previous IEA outlook had assumed would slip.
What the 2035 figure is not: it is not a forecast of the next COMEX HG settlement price. It is a structural scenario metric, anchored in 2035, based on announced and probable projects, with no guarantee that permitting, financing, community relations, or power supply hold together. The 25% gap is the kind of number that should inform capex decisions and resource-strategy planning, not a 2026 trade.
The World Bank numbers fit a different box. Its April 2026 Commodity Markets Outlook forecasts an annual average copper price of $12,000 per metric tonne for 2026 and $11,000 per metric tonne for 2027, against a 2025 average of $9,947. These are benchmark commodity-price forecasts — they read like LME-style annual averages — and they should not be presented as a guaranteed COMEX futures outcome, a particular expiry, or an intraday print.
ICSG says surplus in 2026 and 2027. The IEA says 25% gap by 2035. The World Bank says $12,000 then $11,000. Each is right in its own register, and useless in the others'.
The bottom line for copper futures pricing
A defensible copper futures price prediction for 2026 and 2027 is not a single number. It is a stack of conditional reads, weighted by what the physical market is actually doing this quarter:
- Base case — ICSG balance holds, secondary supply delivers, Chinese demand grows 1.9%. Refined market is in surplus, the curve drifts lower into 2027, and the World Bank's $11,000-per-tonne 2027 average reads as a calibrated central expectation.
- Concentrate-tight case — Grasberg or Kamoa slip again, smelter throughput is cut, primary refined production misses. Surplus shrinks or flips, treatment charges stay punitive, the LME nearby backwardation widens. Supportive for the front of the curve, less so for the back.
- Chinese demand miss — grid capex rephased, property completions slip, scrap export flows tighten. Apparent demand undershoots, but only if unreported Chinese stocks aren't quietly absorbing cathode. This is the hardest case to read in real time, and therefore the one most likely to break a forecast.
What I'd actually weight for the next settlement window: the LME cancelled-warrant share, the COMEX-LME spread, treatment-charge direction, and any further named disruption at Grasberg, Kamoa, or a Chilean concentrator. The macro calls — "supercycle", "green revolution", "AI demand" — are fine for slide decks. They don't move a cathode through a warehouse gate, and they don't show up in the warrant data that drives the next tick on the screen.