Energy Transition Market Set for Strong Growth Driven by Clean
Energy-transition tape is printing volume, not price. openPR reports a market set for strong growth driven by clean energy, while Chemical Industry Digest frames the same trade against a hard…
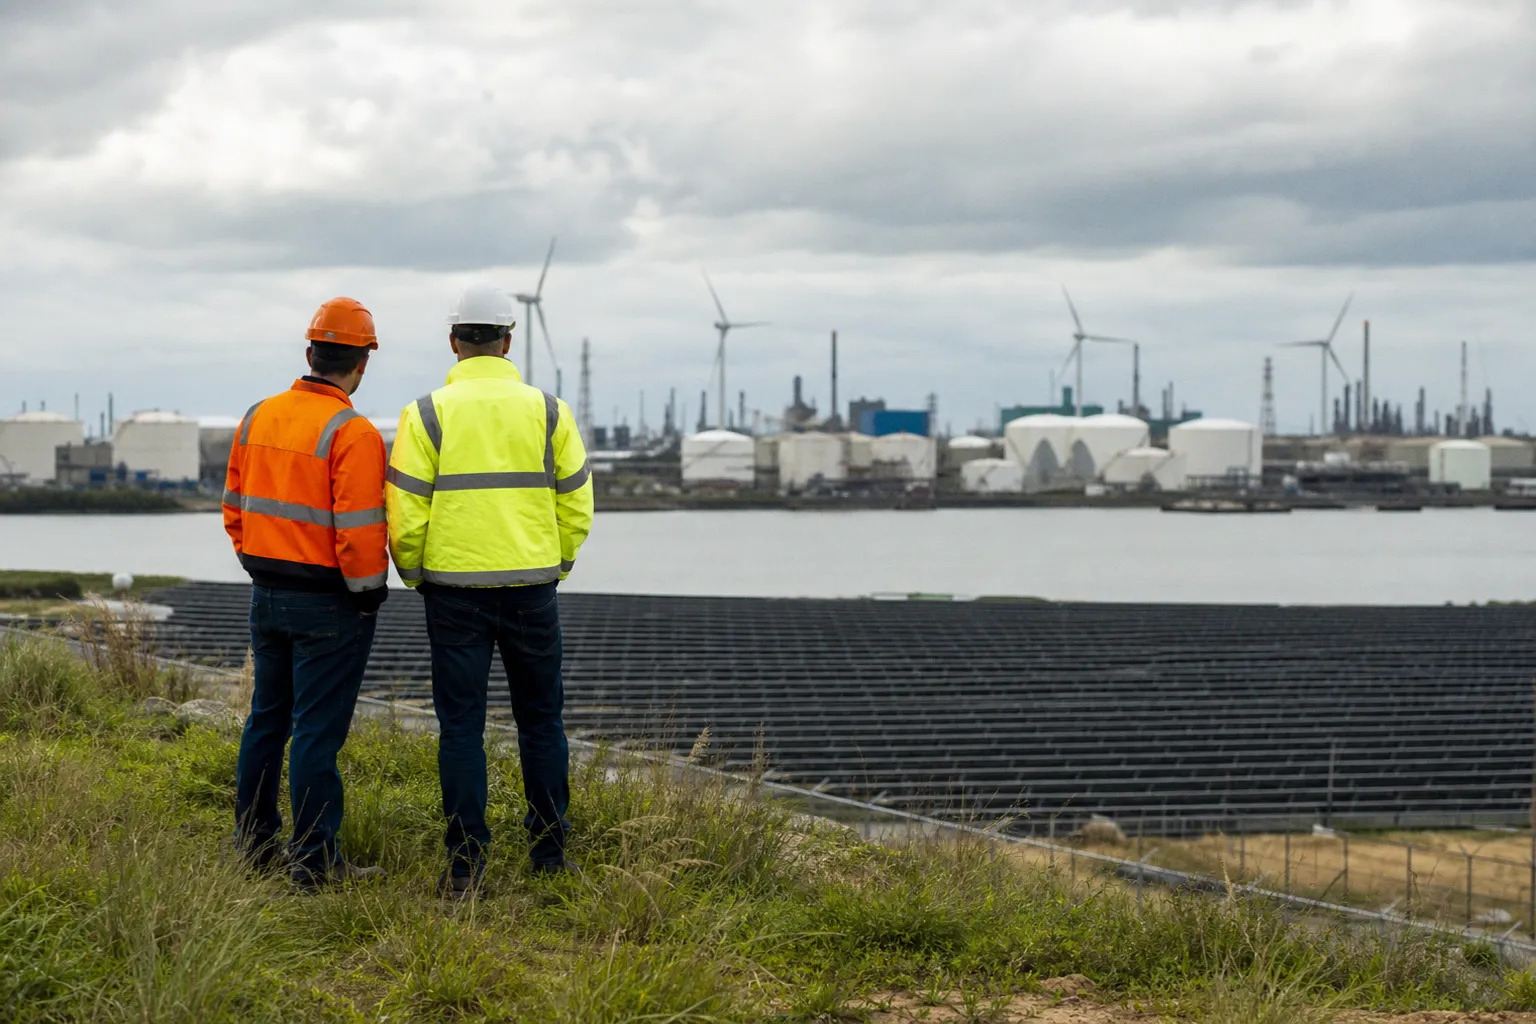
Energy-transition tape is printing volume, not price. openPR reports a market set for strong growth driven by clean energy, while Chemical Industry Digest frames the same trade against a hard constraint: fossil CO₂ emissions kept making records through 2024 despite record renewable deployment. For commodity desks, this is not a clean bullish/bearish signal. It is a basis-risk story across oil, power, metals, carbon, hydrogen, and capture-linked flows.
Clean-energy growth is not yet a crude short
The headline says growth. The structure says overlap.
Chemical Industry Digest describes 2020–2024 as a period where emissions rebounded after the pandemic while renewable deployment also hit records. Fossil CO₂ is cited at about 36.6 Gt in 2022, 37.4 Gt in 2023, and 37.8 Gt in 2024. Atmospheric CO₂ is cited near 424 ppm in September 2025 versus 410 ppm in January 2020.
Translation for energy traders: transition demand does not erase hydrocarbon demand on a straight line. It creates parallel books. One book prices fossil fuels, refining margins, and transport fuel exposure. The other prices solar, wind, storage, green hydrogen, CO₂ valorisation, and carbon capture.
That means the cleaner read is not “oil down, renewables up.” It is dispersion. Watch crude time spreads, product cracks, power curves, and industrial metals spreads separately. Correlation is not the trade. Cross-asset convexity is.
Carbon constraint is moving from narrative to input cost
Chemical Industry Digest points to policy gaps between net-zero pledges and implementation. It also says power, industry, and transport remain the dominant sectoral contributors. That matters because those are the same nodes where commodity contracts settle into physical cost.
The source also notes weakening natural carbon sinks. Forests and soils are cited as sequestering only about 1.5–2.6 Gt versus historical averages near 7.3 Gt. Land-use change is cited at about 4.2 Gt CO₂ in 2024.
No futures curve is attached to these figures. No confirmed price target. No verified carbon-credit spread. So the desk should not convert this into a directional carbon call. The tradable implication is narrower: carbon removal, capture, CO₂-to-fuels, chemicals, and materials remain part of the capex stack described by the source.
That stack changes optionality. It adds duration risk to industrial energy users. It adds input uncertainty to refiners, chemicals, power generators, and metals processors. It also raises the value of watching carbon-credit liquidity, compliance-policy calendars, and project-level offtake terms instead of headline transition CAGR.
Regional and corporate signals are still thin data
CarbonCredits.com reports on MENA reshaping the global energy future from oil to renewables. ad-hoc-news.de flags Shell strategy and energy-transition context. The available snippets do not give confirmed project sizes, spending numbers, production targets, or timing.
So treat them as watchlist items, not executable signals.
MENA matters to the transition tape because it sits across oil, gas, power, and renewables. Shell matters because integrated majors transmit transition strategy into capex, LNG exposure, refining configuration, and shareholder-return constraints. But without confirmed figures, the correct position is flat on specifics.
The screen to run now:
— crude backwardation or contango versus transition headlines;
— refinery crack spreads versus transport-policy signals;
— industrial metals spreads versus storage and grid buildout language;
— carbon-credit volumes versus capture and CO₂-utilisation announcements;
— hydrogen project news versus confirmed offtake, not slogans.
Bottom line: the energy-transition market is being described as growth-driven by clean energy, but the commodity tape is still two-sided. Fossil emissions remain high. Renewables are scaling. Policy implementation is uneven. Until open interest, curve shape, and physical premiums confirm the move, this is not a breakout. It is a volatility surface.